Product Overview
Our Canatek Iot Energy Monitoring System provides a secure and cost effective solution to advanced energy monitoring. Much like when you purchase a GPS with your car, there are no ongoing fees related to the use of our energy platform. With our first product offering entering the marketplace in 2012, our systems have evolved into the versatile, feature rich products we have today. Our made in Canada systems offer outstanding value whether you are an individual homeowner or need to have a complex system monitoring thousands of individually labelled loads at different locations throughout the world. With security much like internet banking, your energy consumption data may be viewed live in real time or over time on a smart phone, tablet, or computer. You may also provide secure read only access to a particular person for a particular load. Eg: Each manager of a hotel in a chain may be provided with read only access to his or her particular hotel for which they are responsible. The Canatek Platform will also provide you with an alert if your power goes off and let you know when it is restored. Our systems are easy to install with an intuitive one page installation and set up guide. Please review the various screens provided by our energy platform as outlined below. For detailed technical information and a complete outline of the operational capabilities of our systems, please download our informative data sheet. All of our systems have complete regulatory approvals for installation anywhere in North America. Without limiting the foregoing our approvals include FCC, Industry Canada, CE, and Canada/US ETL safety approval to both CSAand ULstandards. When it comes to customer service and support, we strive to be second to none in our industry. If you have any further questions, please call us toll free at 1-855-351-0144 Monday to Friday 9 am to 5 pm EST or send us an e mail at sales@canatekinc.com. For technical questions related to the set up and operation of large commercial systems, you may also e mail us at support@canatekinc.com.
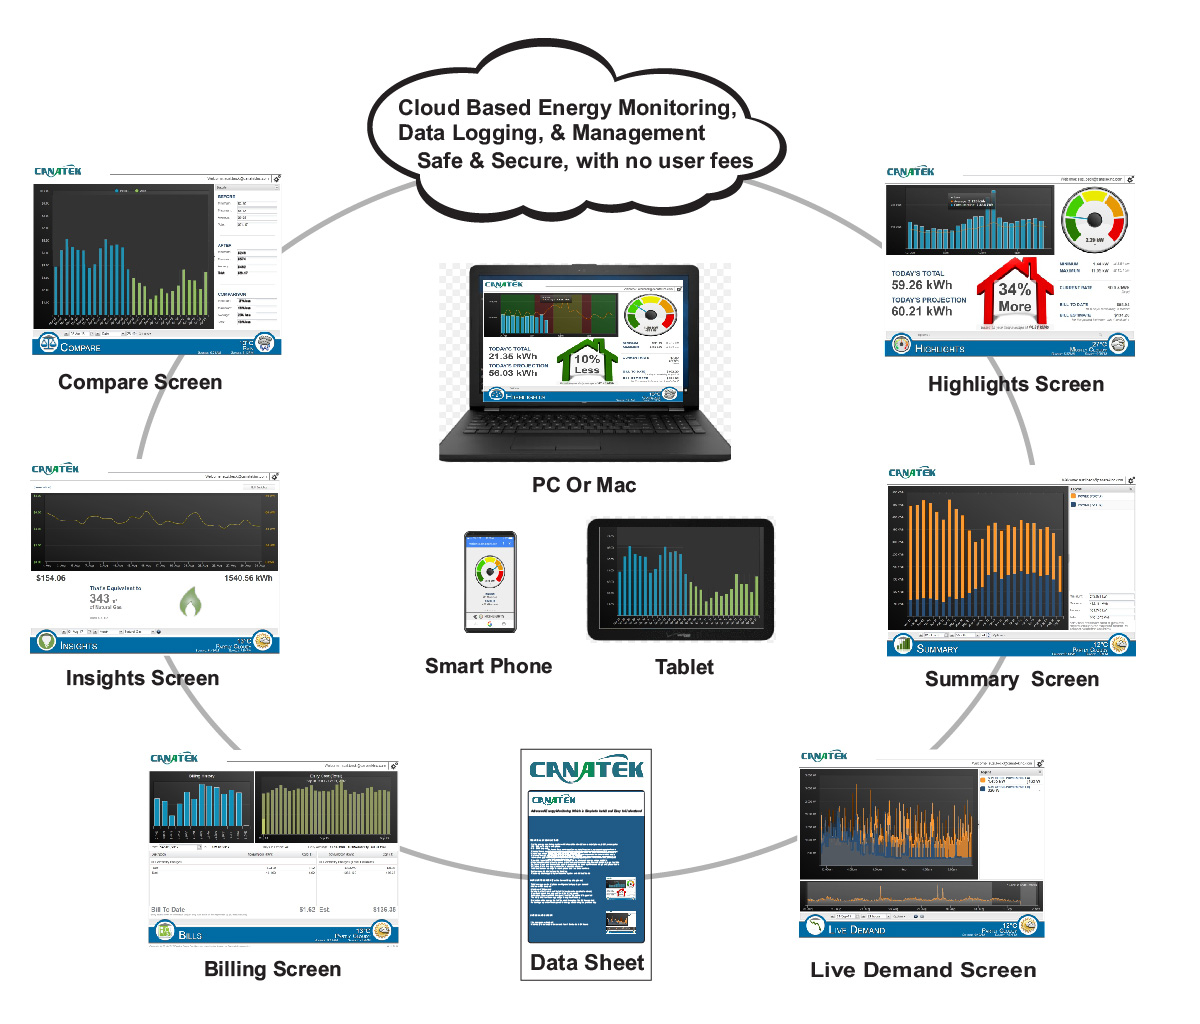
Highlights Screen
The Highlights Screen is your daily default energy monitoring screen. Whether you have a single home or need to monitor a condominium with hundreds of units, a large factory, a commercial campground, or a ship at sea, the highlights screen empowers you to see what is going on related to the use of energy. On the one screen you will see a live reading of energy now including the minimum and maximum demands for energy. The informative graph provides an excellent visual reference at a glance regarding energy usage including average consumption. You will also see how much energy you have used so far today, your projected daily usage, a percentage figure of whether you are using more or less energy than your average. The current rate for energy is displayed along with how much your energy bill is to date and a projection of how much your bill will be at the end of your billing cycle.
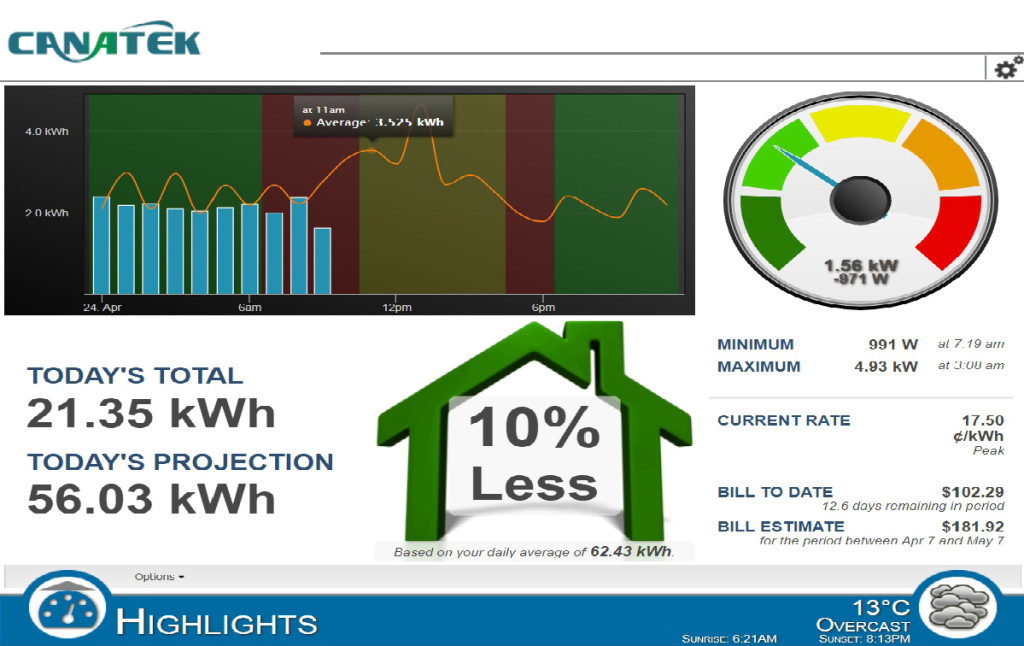
Summary Screen
This screen provides a summary of per phase usage of energy over time as well as total usage. The summary of information periods are selectable including every 15 minutes, hourly, daily, weekly and monthly. The colour graphic overview for each selected period shows how much energy was consumed in kilowatt-hours or the cost of energy. For each selected period the minimum, maximum, average and total energy usage are displayed in kilowatt hours. In the example above we can see how unbalanced and inefficient the installed electrical service is as there is far more energy being drawn on the one side of the line compared to the other. This becomes a serious issue if the homeowner needs to run their home on a generator, or commercially, where utilities punish customers financially for having unbalanced 3 phase loads. Moving the cursor over the graph provides a pop-up window with the actual readings on each phase and the total reading for the selected time period.

Live Demand Screen
The live demand screen provides you with a historical view of the demand for energy in either kilowatts or amperes. The graph is viewable in selectable segments from a period of 15 minutes to 24 hours. You are also able to see any one of the phases on the graph or all of the phases at once. By moving the pointer of your mouse over the graph, you may see the peak demand on any given phase at any moment in time.
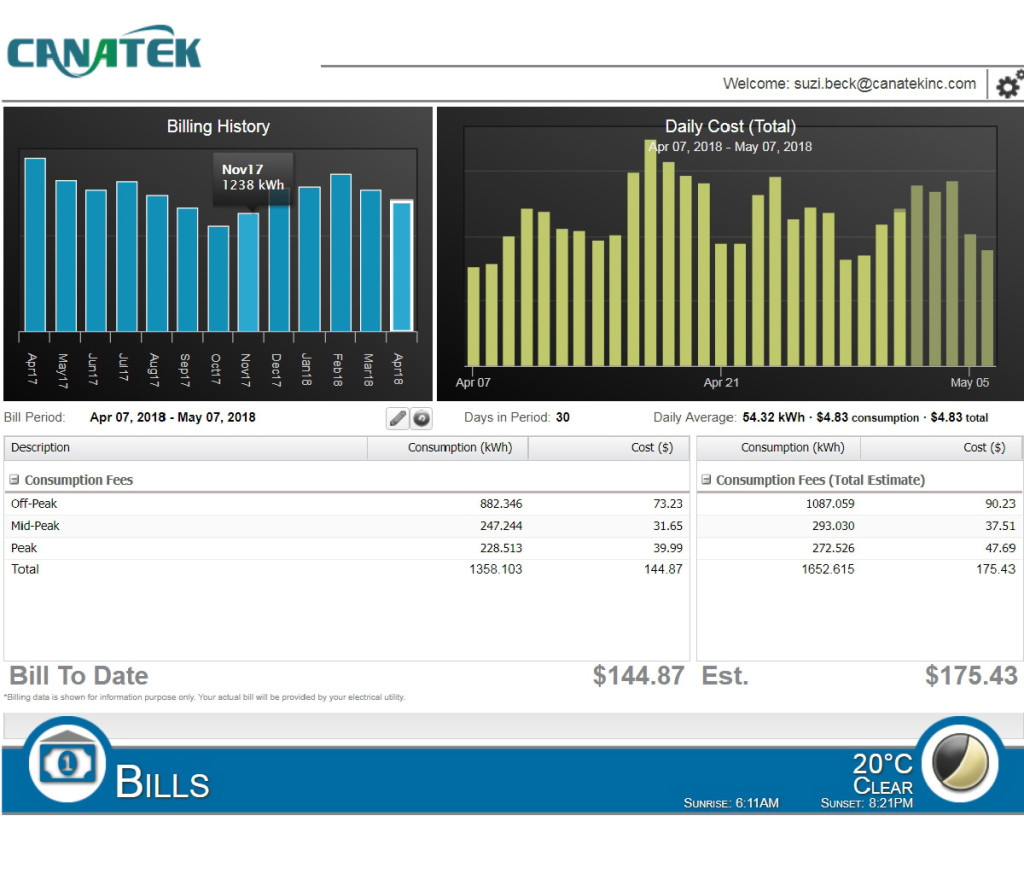
Billing Screen
The billing screen is a powerful tool for having anyone understand their cost of energy throughout any selectable billing period. Our platform will follow most utility billing structures including time of use, progressive by consumption or fixed rate. By moving the mouse pointer over the informative graphs a pop up window will display how much energy was used during previous billing cycles and the cost of energy for any day during the current billing cycle. A bill to date displays the cost of energy used so far during the billing cycle and what the estimated total bill will be at the end of the billing period. There are so many credible uses for the billing screen. Once tenants know that their consumption of energy is being monitored, overall usage of energy, typically drops in the range of 30 to 35%. The abusive waste of energy can also be enforced related to “energy included” leases. Tenants who use less energy may also be rewarded. Our energy platform empowers Tenants and Landlords alike.
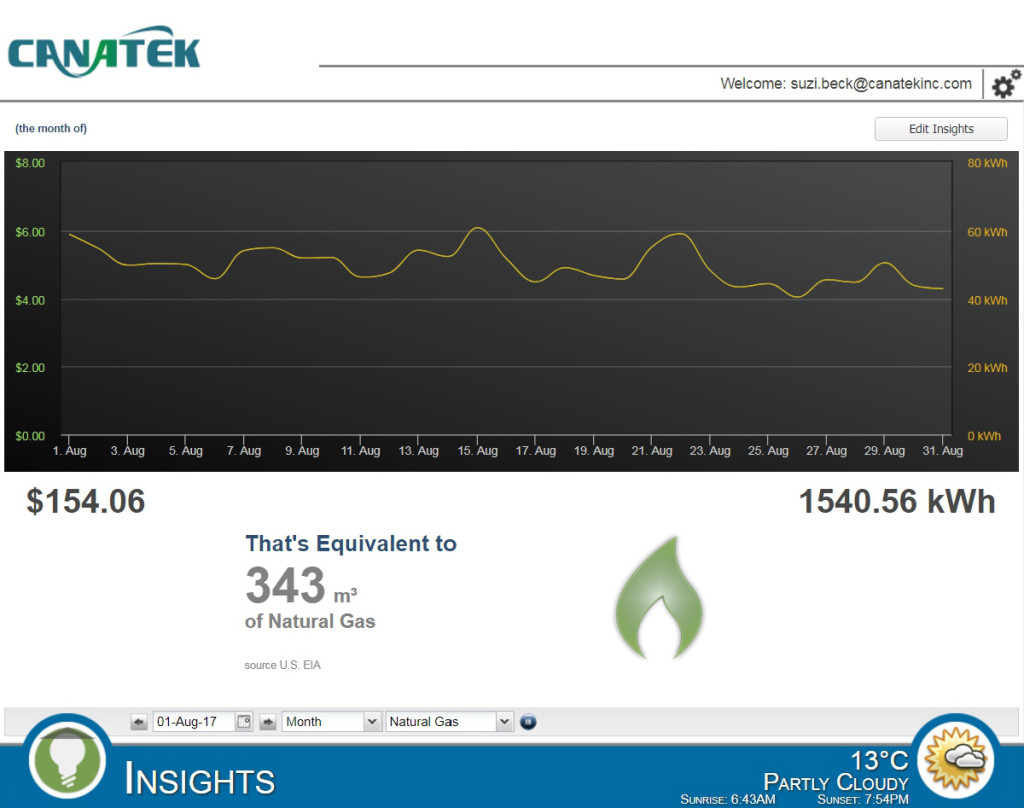
Insights Screen
The Insights Screen allows you to examine your consumption of electrical energy during a selectable period and compare that usage to another form of energy such as Natural Gas. The fact is, the insight screen is both informative and fun in the comparisons it makes to the use of energy in the real world compared to your particular use of energy. Example: Measure the energy your electric hot water heater uses over the period of a month and use the insights screen to determine if switching to a natural gas water heater makes sense.
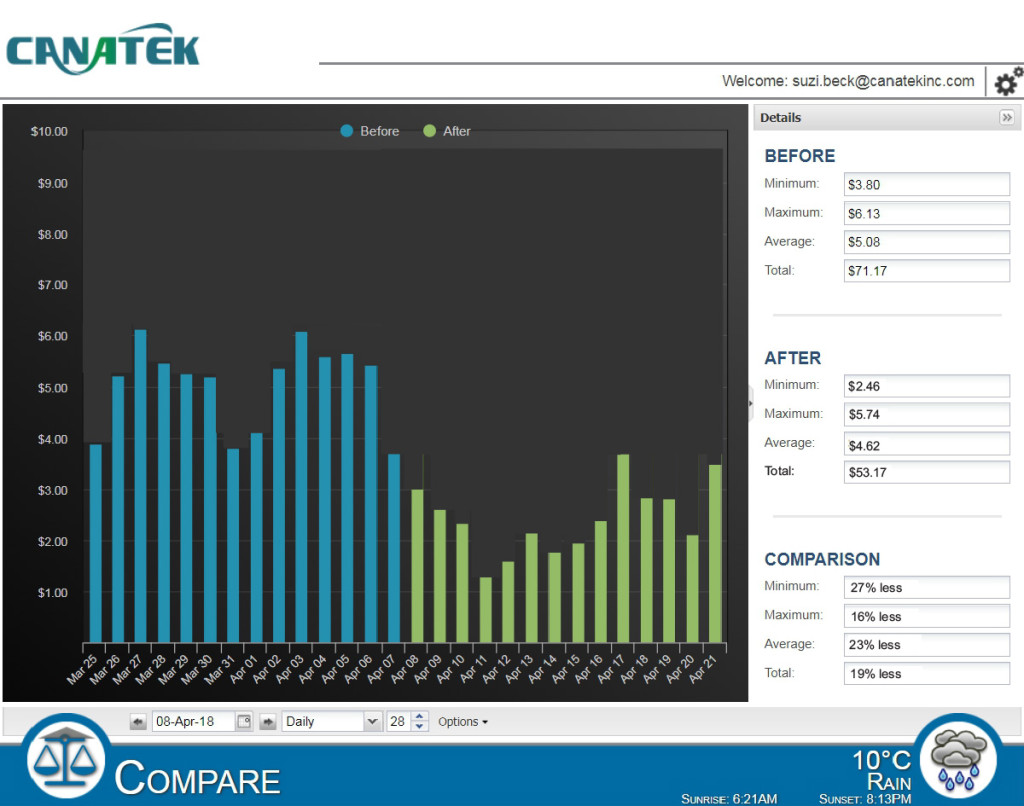
Compare Screen
The compare screen allows the user to make a meaningful comparison related to how implemented energy-saving changes have actually impacted their use of energy. This could be something as simple as changing all the light bulbs in a house to LED or a greater change such as the installation of a ground source HVAC system. In addition to the selectable time periods and informative graph, numerical data and percentages related to improvements are also provided with before and after comparisons.